Table of Contents
Debugging using VisualDSP++
Level: Advanced
The VisualDSP IDDE can be used to debug the compiled code.
note: use the Debug Probe to track program flow and variable states with very small impact to the run time behaviour.
Useful VisualDSP commands
The following commands are useful to control and debug a compiled project:
| command | menu | shortcut | remarks |
|---|---|---|---|
| connect to target | session → connect to target | target name is displayed in the title bar if connected | |
| disconnect from target | session → disconnect from target | ||
| load a executable (*.dxe) | File → Load Program… | Ctrl + L | |
| run a loaded executable | Debug → Run | F5 | |
| halt a running program | Debug → Halt | Sift + F5 | |
| view call stack | View → Debug windows → Call stack | ||
| view disassembly | View → Debug windows → Disassembly | ||
| view memory content | Memory → Blackfin Memory |
Call Stack
When a program is halted the call stack shows the actual execution position of the program.
The example below shows that some code in the advanced_debugging_subvi.vi is executed wich is called by advanced_debugging_main.vi
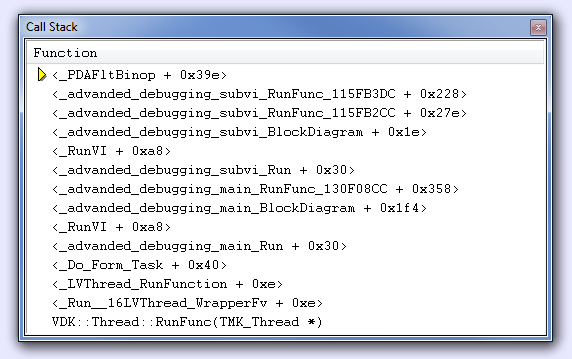
The call stack is a snap shot of the program state.
The context is switched by the kernel or by a interrupt, therefore it might look very different just a few micro seconds later.
The example below shows the same application as the one above but halted in a periodically called Kernel function:

Disassembly
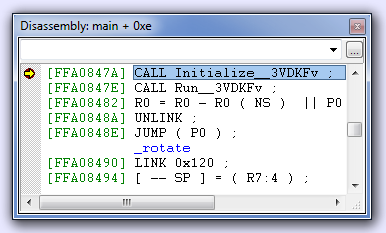
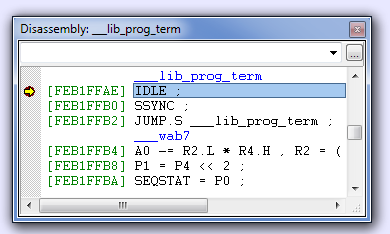
The disassembly window shows the assembly code generated by the C compiler.
When a application is loaded and not yet started the disassembly window looks like this:
When the LabVIEW code has reached the end the disassembly window looks like this:
Memory
To inspect a memory area on th target follow this steps:
- Load and run the compiled Application in VisualDSP++.
- Press Shift + F5 to halt the program.
- Choose from menu Memory → Blackfin Memory
- type a symbol name in the empty drop down selector.
- Hit the return key.
- Right-click in the Blackfin Memory window → SelectFormat → desired format
Useful symbols are:
| symbol name | fomat | meaning |
|---|---|---|
| _error | Character | Error messages generated in Zsystem VIs (see example below) |
| _se_debugflag | Signed interger 32 bit | Debug Probe |
| __Processor_cycles_per_sec | Unigned interger 32 bit | core clock frequency in Hz |
notes:
-the symbol names are sometimes with or without underline score ( _ ) at the beginning.
-make shure to select the correct format

Statistical Profiling
Statistical profiling is used to examine what the processor spends his time on.
Note: statistical profiling is not possible with low cost ICE-100B debuggers
The example below slows down while running:
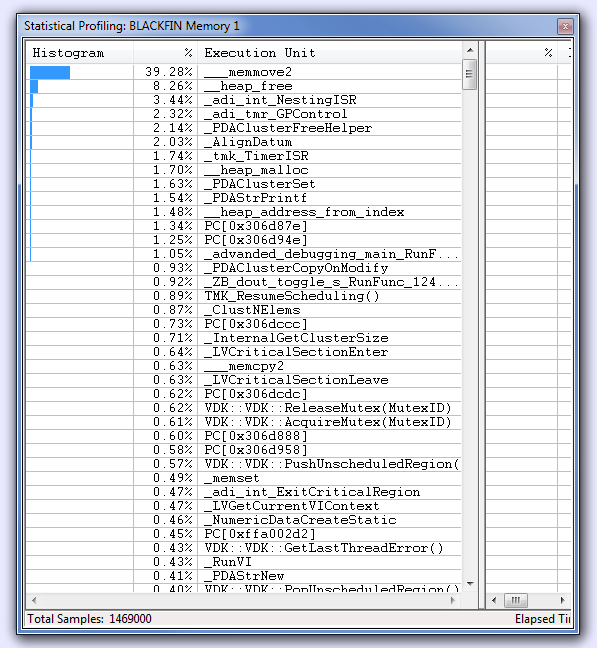
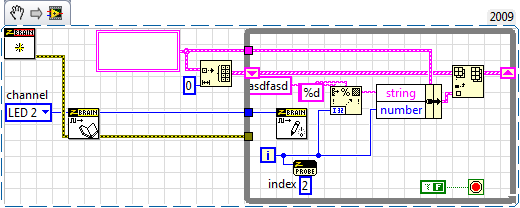
The profiling window shows that the processor is spending most of its time on “memory move”.
Note that the profiling window is updated while the program is running and functions that use more and more processor time can be pointed out by taking screen shots at different execution times.
A totally crashed application would show a profiling fingerprint like this:
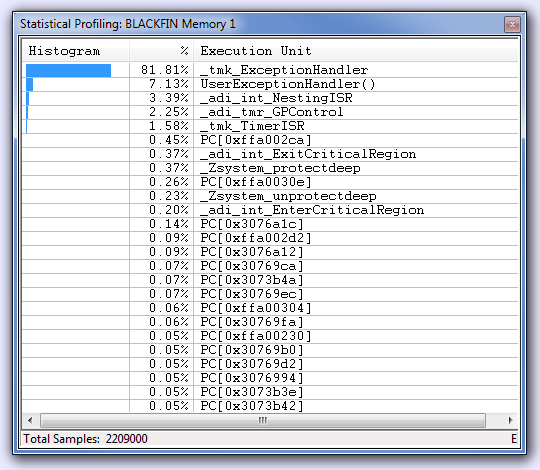
In this example a processor error was forced by writing an 4 byte value to a odd memory address using a c-node.
 Zbrain System Z4