Using the Debug Probe
Level: Intermediate
Track program flow and variable states in the compiled application (*.dxe), with very small impact to run time behavior.
The debug probe writes to a unique memory location, which can be read out using VisualDSP.
A) Insert the Probes into the Blockdiagram
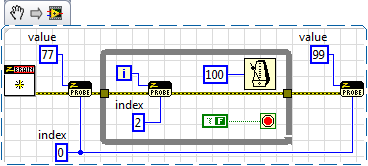
This example shows how the debug probes can be used to track program flow and loop iteration counter:

drag and drop this VI snippet into a LabVIEW block diagram.
index is the number of the probe (0..19).
value can be any number in the I32 range.

index must be between [0..19]
B) Read out in VisualDSP++
- Load and run the compiled Application (*.dxe) in VisualDSP++.
- Press Shift + F5 to halt the program.
- Choose from menu Memory → Blackfin Memory
- type _se_debugflag in the empty drop down selector.
- Hit the return key.
- Right-click in the Blackfin Memory window → SelectFormat → Signed Integer 32 Bit
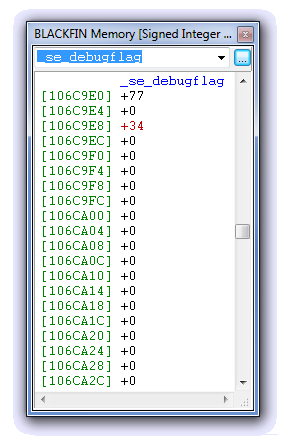
The Blackfin Memory window should now look like this:

The topmost value is our “Index 0”, indicating that the loop has been entered, but not yet exited.
(Otherwise the value would be 99).
The third value (red) is our “Index 2”, indicating 34 loop iterations.
additional information: Debugging in VisualDSP